A spreadsheet of backlinks that’s just next to a column of target URLs is not a link building reporting- it’s just an invoice with extra steps.
It’s also the reason why link building budgets get paused – not just because the links were bad, but because nothing in the link building report connects the benefits of link building to anything the person reading (i.e., executive) cares about.
So when the champion who approved the campaign moves on, whoever inherits the line item sees that list of URLs, no evidence, and just an easy cut.
In this guide, we cover the standard stuff: which metrics to track, where to pull each one, how often to send it – that’s table stakes. We also cover the changes that affect the outcome of the meeting: how to prove backlinks caused the results using a control group, what to report in months one through three when rankings haven’t moved yet, how to put a revenue number on it, and how to write commentary clients actually need.
What a link building report is (and who it’s actually for)
What Is a Link Building Report?
A link building report documents the backlinks earned in a given period, the quality of those links, and what changed as a result.
Most link building agencies just send monthly, and agencies running white label link building services for other agencies are reporting into a second layer of stakeholders on top of that — while in-house teams build one quarterly or just when someone asks.
The useful part here is what really comes next, given that every link building report failure traces back to a single mistake: the report was just built for one reader and delivered to a different one.
Here are the roles and what they want:
- Client or account contact wants delivery confirmation – they’re just checking the work against the scope: link count, quality thresholds (usually some definition of niche relevant backlinks), target pages hit.
- In-house SEO lead wants direction – like which tactics are landing, which pages are responding, where should next month’s budget go? – they simply want a segmented view, pages that actually moved and the ones that didn’t – and enough raw data to argue with.
- Executive wants the business case: what did this cost, what came back, and should it continue? They’ll just read the first slide and last number. Everything in between is just risk, like charts they don’t understand.
Here’s what each one needs:
| Client / account | In-house SEO lead | Executive | |
|---|---|---|---|
| Core question | Did we deliver? | What should we do next? | Should this continue? |
| Leads with | Links earned, quality breakdown | Ranking movement by page | Revenue impact, cost per outcome |
| Detail level | High — full link list | High — segmented, exportable | Low — one page, three numbers |
| Cadence | Monthly | Monthly | Quarterly |
| Length | 4–8 pages | Dashboard + appendix | 1 page |
You have to build the client report as your working document. Build executive reports as a separate, deliberate artifact: one page, pulled from the same data, answering only money questions.
Rule of thumb here is if your report can’t be summarized in three sentences that your CFO would find interesting, you don’t have a report yet.
Link building metrics, grouped
We sort metrics into four groups. Acquisition proves the work happened. Quality proves the work was good, and impact proves it mattered. Efficiency proves it was worth the money, though cost per referring domain only means anything if you know how much backlinks cost at the quality tier you’re buying.
If the quality tier itself is what’s in dispute, our guide on how to get backlinks from high authority sites sets the standard you should be reporting against.
Acquisition – did the work happen
| Metric | What it tells you | What it can’t tell you |
|---|---|---|
| Links earned | Volume delivered this period | Whether any of them matter |
| Referring domains | Unique sites linking – the number that actually moves rankings | Relevance or trust of those sites |
| New vs. lost | Net position, not gross | Why links dropped, unless you check manually |
| Link velocity | Pace of acquisition over time | Whether the pace is appropriate for the niche |
| Placements by tactic | Which outreach approaches are converting | Which tactic drove which ranking change |
Quality – was the work good
| Metric | What it tells you | What it can’t tell you |
|---|---|---|
| DR / DA of linking domain | Rough site-level strength | Whether the specific page passes anything |
| UR / PA of linking page | Page-level strength, closer to reality | Topical fit |
| Topical relevance | Whether the link makes sense to a reader | Nothing automated measures this well – it’s a human judgment |
| Follow vs. nofollow | Which links pass direct equity | That nofollow links are worthless (they aren’t) |
| Anchor text distribution | Whether the profile looks natural | A safe ratio – there isn’t a published one |
| Spam / toxicity score | Third-party risk estimate | Anything Google actually thinks. These scores are vendor opinions. |
| Traffic to the linking page | Whether the link can send real referrals | Whether it will |
Impact – did it matter
| Metric | What it tells you | What it can’t tell you |
|---|---|---|
| Ranking movement (target keywords) | The headline outcome | Causation, without a control group |
| Ranking keyword count | Leading indicator – moves before positions do | How valuable the new keywords are |
| Share of voice | Weighted visibility, factoring volume and CTR | Actual sessions |
| Referral traffic | Direct clicks from placements | Assisted value – most good links send near-zero traffic |
| Organic sessions to target URLs | Real traffic outcome | Whether links caused it, vs. content, technical, or seasonality |
| Conversions from target URLs | The number executives want | Attribution across a multi-touch path |
Efficiency – was it worth it
| Metric | What it tells you | What it can’t tell you |
|---|---|---|
| Cost per link | Simplest unit cost | Anything about quality – cheap links are cheap for a reason |
| Cost per referring domain | Better unit cost, since domains are what count | Same limitation |
| Link gap closed | Progress against the competitive target you set | Whether the target was right |
| Estimated revenue impact | The only number an executive is reliably interested in | Certainty – it’s a model, and you should say so |
How many to actually report?
A workable default here is referring domains, new vs. lost (lost links belong in a link reclamation queue, not just a red cell in the sheet), average UR of linking pages, ranking movement on target keywords, ranking keyword count, share of voice, cost per referring domain, and estimated revenue impact.
Where each number comes from
The reporting problem here is rarely which metric, but rather pulling metrics that get done inconsistently – so you’ll find your month-over-month comparisons quietly just stop being comparable.
| Metric | Tool | Path |
|---|---|---|
| Links earned, new & lost | Ahrefs | Site Explorer → Backlinks → filter New / Lost, set the date range to the reporting month |
| Referring domains | Ahrefs | Site Explorer → Referring domains → filter New in period |
| UR / DR of linking pages | Ahrefs | Included in the Backlinks export – no separate pull |
| Anchor text distribution | Ahrefs | Site Explorer → Anchors |
| Trust Flow / Citation Flow | Majestic | Site Explorer → Summary (if you report topical trust) |
| Page Authority of target URLs | Moz | Link Explorer → enter exact URL → Page Authority |
| Ranking positions, target keywords | Semrush | Organic Research → select Exact URL → Positions tab → set month → export |
| Ranking keyword count | Semrush | Same export – count the rows |
| Share of voice | Semrush Position Tracking or Ahrefs Rank Tracker | Visibility / Share of voice metric on the tracked project |
| Impressions, clicks, avg. position | Google Search Console | Performance → Search results → filter by page → compare periods |
| Organic sessions to target URLs | GA4 | Reports → Traffic acquisition, or Explore with Landing page + Session default channel group = Organic Search |
| Referral traffic from placements | GA4 | Explore → Session source / medium, filtered to referral |
| Conversions on target URLs | GA4 | Landing page report with your conversion event as the metric |
Tool interfaces will move, so you have to re-verify these paths once a quarter rather than assuming an export you scripted still returns the same columns in September. And before you flag a missing link as a delivery failure, check whether it’s an indexing lag on the tool’s side – backlinks not showing up in Ahrefs is common enough that it should be ruled out first.
Three rules that make months comparable
Pull on the same day every month. Your rankings will fluctuate daily, so let’s say a pull on the 2nd compared against a pull on the 27th will introduce noise you’ll just spend an hour explaining. Authority scores are just as jumpy – an Ahrefs DR dropped due to losing one link is a known artifact of how the metric is calculated, and it’s easier to pre-empt in commentary than to explain on a call.
Export the same number of keywords per page, every time. So let’s say you export the top 500 keywords for a page in month one and “all keywords” in month two; your average rank will just change for reasons that have nothing to do with your backlinks.
Tag every row on export. You can add two columns to every export before it actually goes into your sheet: date (the month of the data) and group (campaign or control). Given that without these, the whole comparison will just collapse into an undifferentiated pile of rows, and you’ll just rebuild it from scratch next month.
What this costs you monthly
It’s a rough estimate of 40 minutes for a link building campaign of 10 target pages plus a matched control set – once the entire ritual is established. Given that the bulk of it is the SSEMrushpositions export, which is actually one pull per URL per month and doesn’t just batch well – so budget for it, and you can pull the control group in the same sitting rather than just as an afterthought.
Cadence
The default cadence is monthly, not because monthly is a meaningful measurement window for backlinks, but given that it really matches how people are paid, invoiced, and reviewed.
- Monthly for client and in-house reporting – same day each month when you can pull the same pull ritual.
- Weekly only for fast-moving link-building campaigns: launch, competitive push on a small keyword set, or a recovery from a manual action.
- Quarterly for the executive one-pager – the cadence that will actually match the measurement reality – and it’s the one that most teams skip.
There are also ways to handle reports that don’t say anything – here are a couple of tips you can apply:
- Set the expectation in writing before the first report goes out – it’s one of the link building best practices that separates campaigns surviving month three from ones that don’t. Simply tell them the shape of the curve: if it’s flat to slightly negative for 8 to 12 weeks, then any movement, if there is.
- Report leading indicators in months one to three. Ranking keyword count and page-level authority will both move well before positions do. These will become your headline metrics early, then will recede as real ranking data arrives.
Ranking keyword count and page-level authority can both move well before any positions do.
You can actually split the cadence by audience, like monthly to the person who needs to know the work is happening. Quarterly to the role who decides whether it continues, given that a quarter is the shortest window in which you can honestly answer their question.
A workable structure
| Month | What leads the report |
|---|---|
| 1 | Scope confirmation, baseline, links delivered, pipeline |
| 2 | Links delivered, ranking keyword count vs. control, page authority movement |
| 3 | Same, plus early position shifts on lower-competition terms |
| 4+ | Ranking movement vs. control, share of voice, revenue model |
| Quarterly | One page: cost, outcome, recommendation |
Why most link reports don’t survive contact with an executive?
You can do everything so far just correctly, like clean data, right metrics, and consistent pulls, and still lose budget. Given that a competent report and a persuasive one are different things, the gap between them is just where link-building campaigns die.
Link building reports get killed for reasons including these three:
1. No causal claim.
The link-building report shows links went up and rankings went up, in the same actual document, and that hopes the reader will connect them. But given a core algorithm update just went out that month too, so did a competitor’s site migration. A typical case where an executive who may ask, “how do you know it was the links?” is asking a fair question, and “the timing just line up” is not really an answer that survives it.
2. No why.
The commentary may restate the numbers: “referring domains up 14% month over month” sits directly above a chart showing referring domains up 14% month over month. So nothing in the words will tell the readers something the table just didn’t. So this is like a data dump wearing a report’s clothes.
3. No money.
Now this whole thing is expressed in referring domains and just average position – so units that will mean something to an SEO and nothing to the person who controls the budgets. This can lead to no revenue figure, and no cost-per-outcome.
You can fix those three, and the link building report will defend itself.
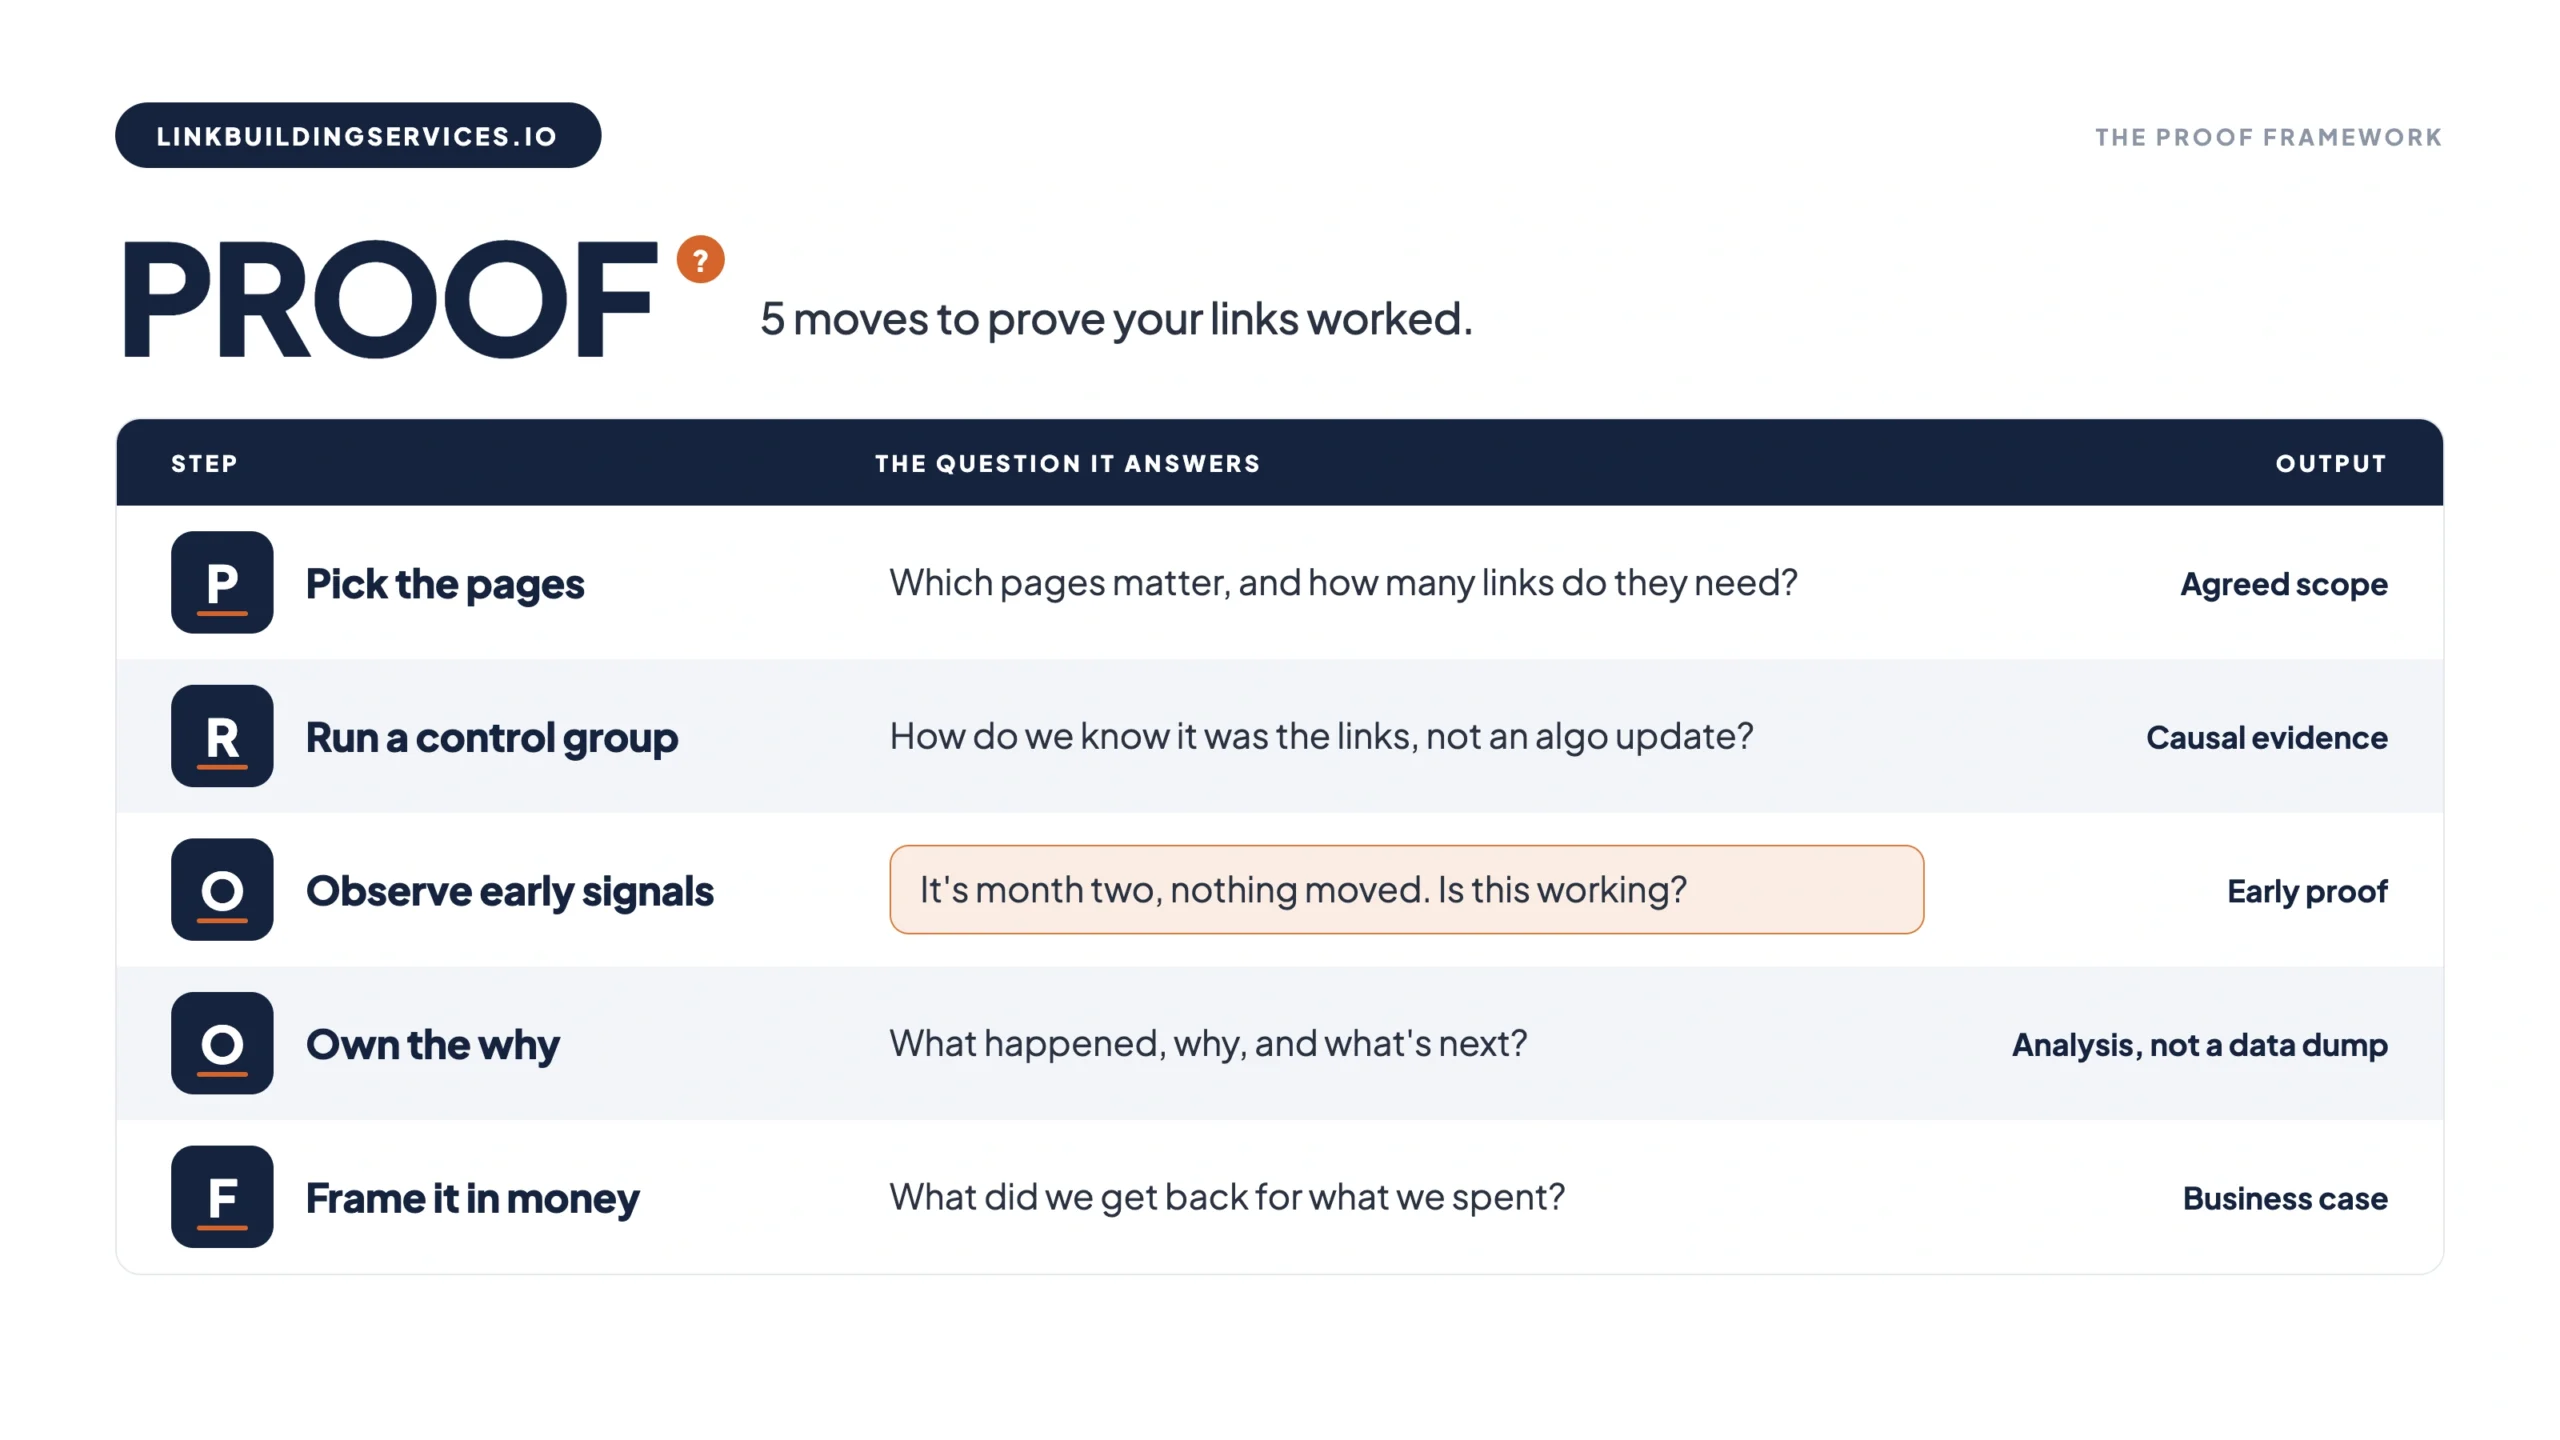 I’ve created a framework to help you win the link building budget before the work even starts: pinpoint the pain, build the business case, and get executive buy-in.
Proof is what you will run after the money’s been spent, to prove it was actually spent, and earn the next round.
The five moves are here:
P — Pick the pages. You can choose revenue-adjacent pages and size the link gap before any kickoff, so month fix is a measurement against an agreed target.
R — Run a control group. You can build backlinks to one set of pages, just leave a matched set untouched, and compare.
O — Observe early signals. You can report ranking keyword counts and page authority in the first three months, while ranking positions are still flat. Then build links to one set of pages, leave a matched set untouched, and compare.
O — Own the why. Go past any remaining numbers to actually explain them: like the difference between a report and an analysis.
F — Frame it in money. You can convert ranking movements into forecasted revenue, subtract baseline, and project it forward.
Now, let’s cover each of them:
Pick the pages and keywords [P]
Choose revenue-generating pages. The obvious activity is to build links to pages that are easiest to earn links for, like blog posts, resource pages, or anything that’s genuinely link-worthy. But you have to choose target pages by working backward from revenue: sales pages, category pages, and high-intent landing pages that can turn rankings into money.
Start running a link gap analysis against the top competitors for each target page’s primary keywords – the same process you’d use to steal your competitors backlinks, except here the output is a target number rather than a prospect list. Then estimate the referring domains needed to close the gap.
Then put that number in front of your client and get agreement on it. Now that number is a shared target – and in month six it’s a measurement against something both sides signed.
Build the keyword scope you’ll report against. Three moves inside your rank tracker:
- Priority keyword group – break high-volume, mixed-intent, low-conversion terms into a named priority segment and report on the separately, alongside the aggregate.
- Exclusion list – pages that accidentally rank for noise, including own brand terms, competitor brand names, top-funnel queries with no commercial intent, or any mixed-intent junk.
- Share of voice as the visibility metric. Share of voice is a weighted visibility score built from rank position, CTR, and search volume – nobody has a competing internal figure to hold it against.
What “done” looks like for this step:
A short, agreed document including target pages, link volume estimate for each, priority keyword segment, exclusion list, and share of voice named as the visibility metric.
Run a control group [R]
The question you need to answer is, how do you know it was the links? Rankings might go up, but that month alone also brought a core algorithm update, or anything you’ll never know about. So the correlation in a single dataset can’t answer the question. But two datasets can.
Pick two sets of pages that look as alike as possible on metrics that matter: ranking keyword count, average position, organic traffic, and backlink profile. Then split them.
- Group A – campaign pages – these get the links.
- Group B – control pages – no links, no content refresh, no technical fixes, and no internal linking pages.
Build links only to Group A. Then report both groups’ trendlines side by side, every month.
When both groups rise together, that’s the algorithm update, season – it’s external. When Group A pulls away from Group B, that gap is your links, isolated from everything happening to the site as a whole. So you’re no longer just claiming causation from timing – you’re actually showing it against a baseline of what would have happened anyway.
You have to keep the test clean. The control group only proves something if the only difference between groups is the links – so that means:
- Lock both groups out of other initiatives. If Group A pages also get a content rewrite this quarter, you can no longer just say the movement came from links – so you’ve run two experiments at once and can’t separate them.
- Isolate to a single variable – one change, measured. A clean attribution is worth more to the budget conversation than na slightly faster site.
- Match groups honestly – so if your control pages are systematically weaker or on different topics, the comparison is rigged, and a sharp reader (your stakeholders) will notice.
What “done” looks like for this step:
Matched control set, chosen at kickoff, and charted next to the campaign group in every report. It’s one of the most technically demanding moves in the framework, but one that will win the argument.
Observe early signals [O]
The core fact to internalize and communicate is the lag between a backlink being built and ranking impact is roughly 3 to 4 months. Walk the client through how long for backlinks to take effect before month one, not after month two when the chart is flat.
Given that Google has to crawl the linking page, crawl, and re-evaluate the target, and let the change settle.
Two things will do more early:
Leading indicator one: ranking keyword count
So before any ranking positions improve, the number of keywords a page ranks for starts climbing, and it will climb faster on pages that earned new links than on control pages that didn’t. New links will expand a page’s reach into new queries well before they even lift its existing rankings.
That’s why having a control group can earn its keep even in month one. Like saying, “Our campaign pages picked up 40% more ranking keywords than the control set this month” is a real, defensible early signal.
Leading indicator two: page-level authority
Third-party page authority scores will react to new links quickly, just long before rankings will respond. So they’re a proxy for link popularity rather than a measure of ranking, and you should say so.
But for a rising page authority on target pages, tracked against a flat control group, it’s just early evidence the backlinks are registering.
These two metrics will give you a substantive month one and month two reports: links delivered, ranking keyword count, climbing versus control, page authority just rising versus control.
What “done” looks like for this step:
Months one through three will lead with keyword count and page authority – which is both against control, and reports explicitly will forecast the average-rank dip before it will appear. So by month four, real ranking movement will take over as the headline and the leading indicators will recede to supporting roles.
Own the why [O]
You don’t need long captions and paragraphs in your link building reports. You just need exactly these three sentences:
- What happened – movement, stated once.
- Why – the cause, as far as you can honestly establish it
- What’s next – decision or action that follows
This kind of structure forces analysis.
Copy-paste starting points:
Good month: “Rankings on [target pages] climbed an average of [X] positions, pulling clearly ahead of the control group — this is the links converting, roughly on the timeline we forecast. Next month we hold the current approach and start reporting revenue impact.”
Flat month: “Rankings held roughly steady this month, in line with the [3–4 month] lag we flagged at kickoff. Leading indicators — keyword count and page authority — continued rising against control, so the underlying signal is intact. We expect position movement to begin next month.”
Mixed month: “[Priority keyword] moved up [X], while the broader set was flat — the head term is responding faster than the long tail, which is unusual and worth watching. We’re investigating whether a recent SERP-feature change is compressing clicks, and will report findings next month.”
What “done” looks like for this step:
Every section of the link building report must carry: what, why, and what’s next – and no line will survive the deletability test as filler.
Frame it in money [F]
Forecast revenue the same way that paid channels do: with a model, disclosed assumptions, revised when challenged.
You can borrow the paid search logic – crucially, ROAS will use only hard costs – so if you model organic the same way, with the same permission to keep it simple, it’d be doable.
Here’s the full worked example. It’s a model, and every input is an assumption you should state, including cost, which is easiest to defend when your retainer divided by delivered referring domains lands in line with published link building packages.
Baseline – what the page earns today
| Input | Value |
|---|---|
| Current average position (top 50 keywords) | 12 |
| Combined monthly search volume | 20,000 |
| CTR at position 12 (from a CTR study) | 0.88% |
| Monthly clicks | 176 |
| Conversion rate (sales page) | 1.5% |
| Monthly conversions | 2.64 |
| Revenue per conversion | $500 |
| Baseline monthly revenue | $1,320 |
Target – what the page earns if you hit position 4
| Input | Value |
|---|---|
| Target average position | 4 |
| CTR at position 4 | 5.65% |
| Monthly clicks | 1,130 |
| Monthly conversions (at 1.5%) | 17 |
| Target monthly revenue | $8,500 |
Net-new is the number here that matters. Simply subtract the baseline. Let’s say the page was already earning $1,320 without your help – so your links are responsible for the difference, $7,180 per month in net new revenue.
Report cumulative revenue – not just monthly. You can chart the running total of net new revenue against the one-time cost and mark the crossover month. So the line that pulls away here from a flat cost baseline is really the single most persuasive image you can put in front of an executive.
What “done” looks like for this step:
The link building report now carries a revenue model with visible assumptions – reporting a net-new rather than just gross and expressing ROI cumulatively over a 12 to 24-month horizon with the crossover month marked.
Final Thoughts
Most link building reports will just answer, “what did we build?” – our PROOF framework answers the only question that keeps a link building campaign funded: “what did it earn, and how do we know?” Get that on the page, and the renewal argues itself. And if you’re deciding who does the work you’ll be reporting on in the first place, start with our breakdown of the best link building services.
Written By

Reviewed By

Sef Gojo Cruz
COO at SharpRocket, overseeing end-to-end operations, from crafting link building strategies to leading high-performing teams. Previously led SEO initiatives at Workhouse, a digital agency in Australia, and Keymedia, a real estate media company based in New Zealand.